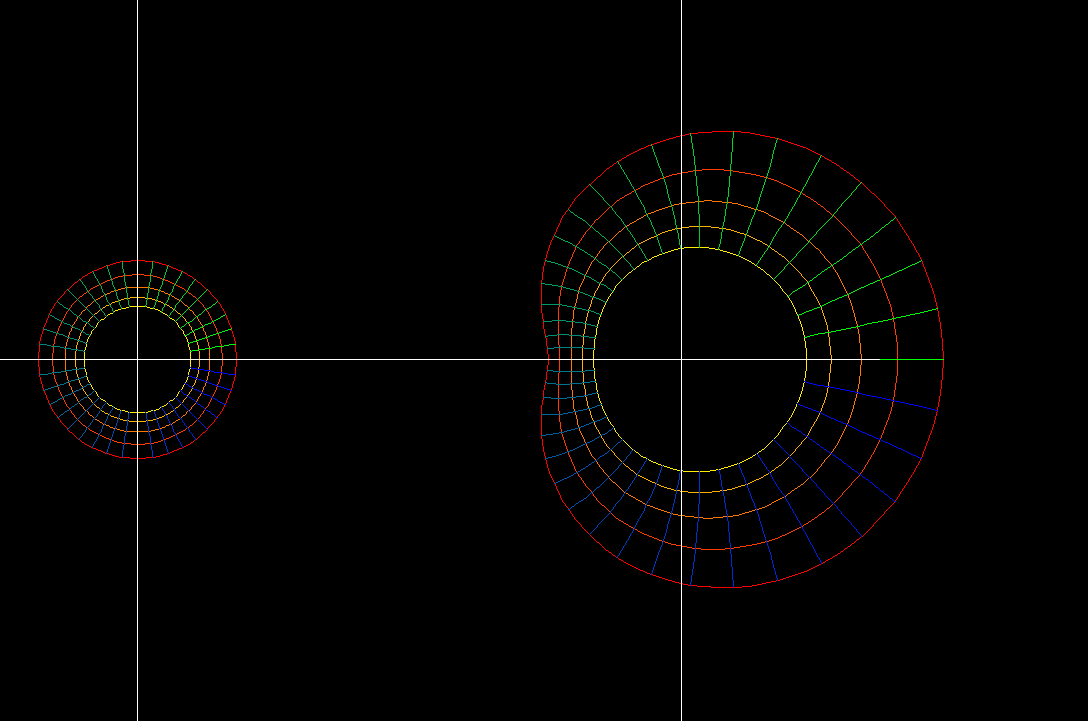
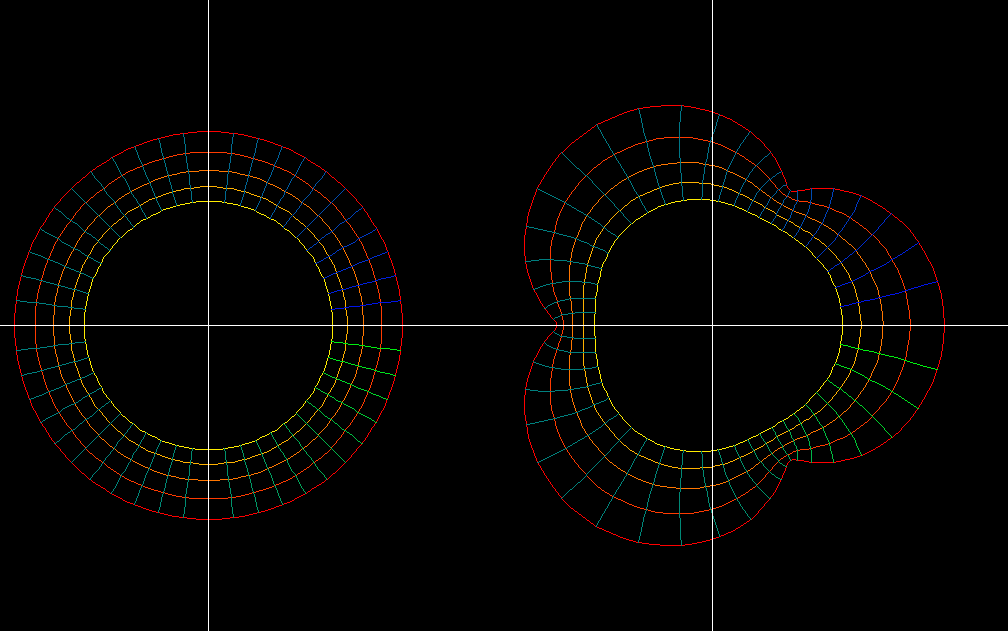
map: z → f(z) = a*z^2 + 2*z
domain: 0.7 < |z| < 1.3
morph: 0.5 < a < 1.5
Observe that the slightly curved parameter squares in the domain are mapped to
“curved squares” in the range. All angle preserving (=conformal) maps have this property.
When a parameter circle of the domain hits the point z0 where f'(z0) = 0 then the image
of this circle is a cardioid. The other parameter circles are mapped to limacons.
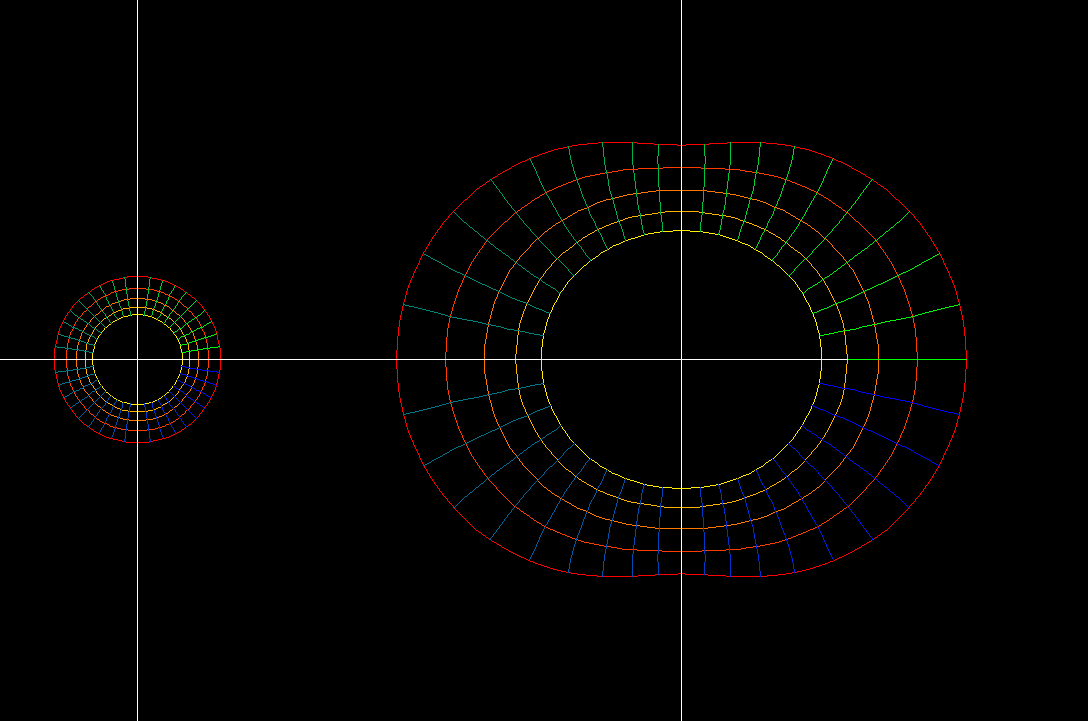
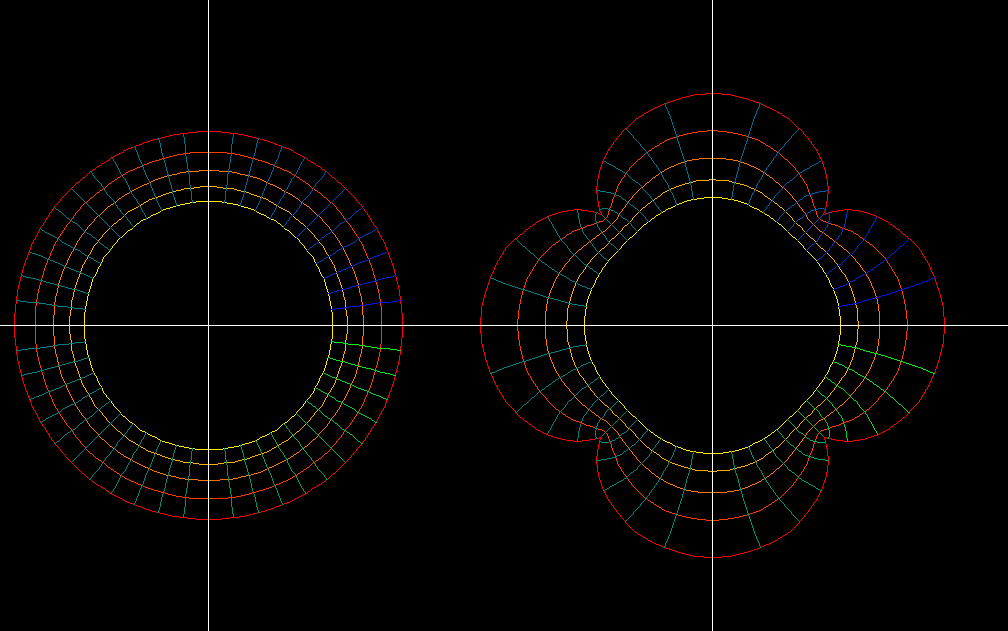
map: z ⟶ f(z) = a*z^3 + 3*z
domain: 0.7 ≺ |z| ≺ 1.3
morph: 0.25 ≺ a ≺ 1.25
As for all conformal maps we see: The “curved parameter squares” in the domain are mapped
to “curved squares” in the range. Near the zeros of f’ the image squares are very small.
The parameter circles which hit the zeros of f' are mapped to
Nephroids
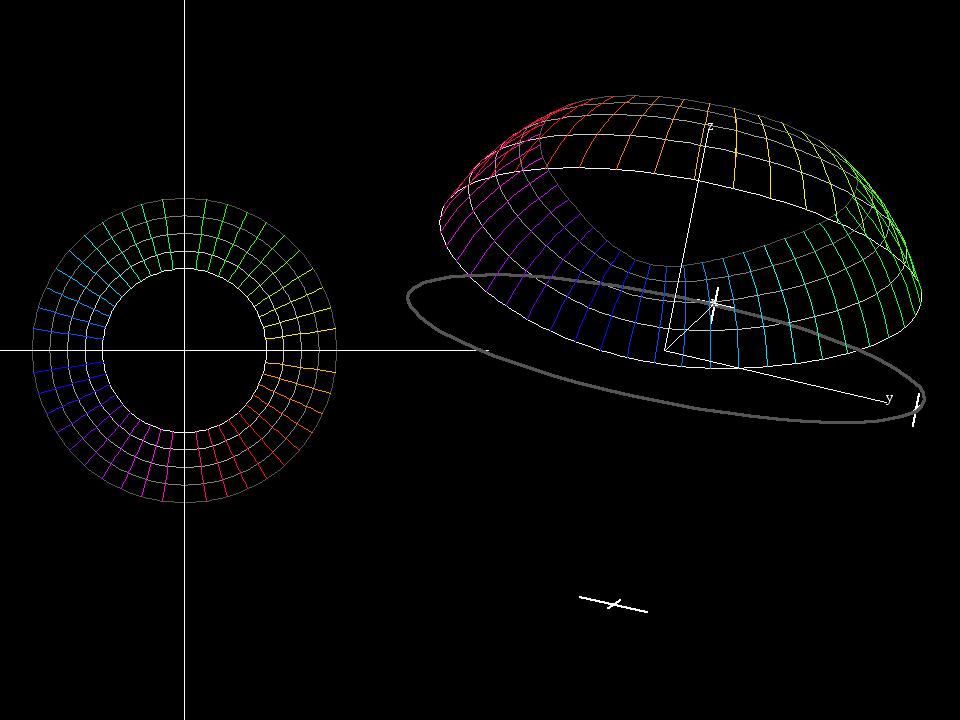
power2 riemann 001
The same deformation as before:
map: z → f(z) = a*z^2 + 2*z
domain: 0.7 < |z| < 1.3
morph: 0.5 < a < 1.5
But the image is shown on the Riemann sphere, using stereographic projection from the Gaussian plane
to the Riemann sphere.
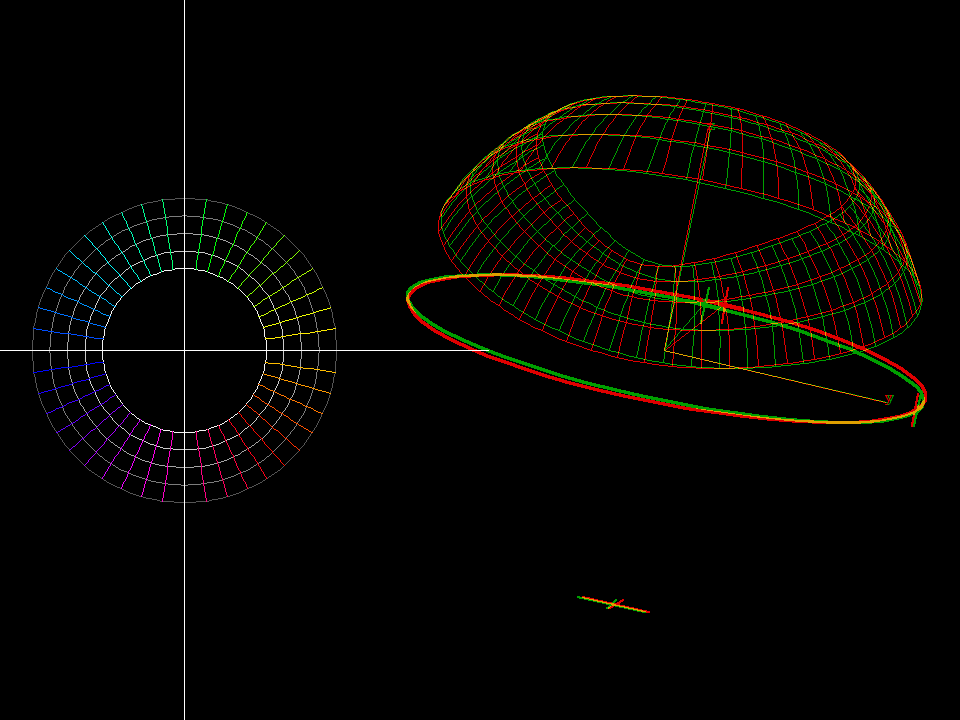
Same deformation as before on the Riemann sphere. The anaglyph rendering shows the spherical
shape of the image much better.
Note that the circles t → exp(i*t) in the domain are mapped to exp(i*t) + c*exp(4i*t)
in the range. We recognize them as cycloidal curves. (that is, curve traced by rolling a circle on another circle.)
In this case we have three zeros of the derivative. But the behavior of the map near
these critical points is the same as in the earlier cases (near the zeros of their derivative).
Observe an important fact of complex analysis: No interior point of the domain is mapped to
the boundary of the image. In other words: The boundary of the image set consists only of
images of boundary points. No fold lines as in the non-conformal example can occur.
Observe for all conformal maps that the parameter quadrilaterals in the range near f(z)
are much smaller than the parameter quadrilaterals in the domain near z where
the derivative f'(z) vanishes.